




What are the calibration curve fitting methods for a Hexavalent Chromium Analyzer?
 Jul 07, 2025|
As a supplier of Hexavalent Chromium Analyzers, I often get asked about the calibration curve fitting methods for these devices. Calibration is a crucial step in ensuring the accuracy and reliability of any analytical instrument, and the Hexavalent Chromium Analyzer is no exception. In this blog post, I'll walk you through some of the most common calibration curve fitting methods and explain how they work.
Why Calibration Matters
Before we dive into the fitting methods, let's quickly talk about why calibration is so important. Hexavalent chromium is a highly toxic substance that can have serious health and environmental impacts. Accurate measurement of hexavalent chromium levels is essential for regulatory compliance, environmental monitoring, and industrial process control. A well - calibrated analyzer ensures that the results you get are as close to the true values as possible.
Linear Regression
One of the simplest and most widely used calibration curve fitting methods is linear regression. In linear regression, we assume that there is a linear relationship between the concentration of hexavalent chromium (the independent variable) and the analyzer's response (the dependent variable). The general equation for a straight line is (y = mx + b), where (y) is the analyzer's response, (x) is the concentration, (m) is the slope of the line, and (b) is the y - intercept.
To perform linear regression, we prepare a series of standard solutions with known concentrations of hexavalent chromium and measure the analyzer's response for each solution. Then, we use statistical software or a calculator to find the values of (m) and (b) that best fit the data points. The "best fit" is determined by minimizing the sum of the squared differences between the observed values and the values predicted by the line.
The advantage of linear regression is its simplicity. It's easy to understand and implement, and it works well when the relationship between the concentration and the response is truly linear. However, in some cases, the relationship may be non - linear, and linear regression may not provide an accurate fit.
Polynomial Regression
When the relationship between the concentration and the analyzer's response is non - linear, polynomial regression can be a better option. A polynomial equation has the form (y=a_0 + a_1x+a_2x^2+\cdots+a_nx^n), where (n) is the degree of the polynomial. For example, a quadratic polynomial ((n = 2)) has the equation (y=a_0 + a_1x+a_2x^2).
To use polynomial regression for calibration, we follow a similar procedure as linear regression. We prepare standard solutions, measure the responses, and then use software to find the coefficients (a_0,a_1,\cdots,a_n) that minimize the sum of the squared differences between the observed and predicted values.
Polynomial regression can capture more complex relationships between the concentration and the response, but it also has some drawbacks. Higher - degree polynomials can be more prone to overfitting, which means that the curve may fit the calibration data very well but perform poorly when predicting new data.

Non - Linear Regression
In some cases, the relationship between the concentration and the analyzer's response may not follow a simple polynomial pattern. Non - linear regression is a more flexible method that can handle a wide variety of non - linear relationships. There are many different non - linear models available, such as the exponential model ((y = a\cdot e^{bx})), the logarithmic model ((y=a + b\cdot\ln(x))), and the sigmoidal model ((y=\frac{a}{1 + e^{-(x - b)/c}})).
The process of non - linear regression is more complex than linear or polynomial regression. We need to choose an appropriate non - linear model based on the nature of the data, and then use iterative algorithms to find the parameter values that best fit the data. Non - linear regression requires more computational resources and may be more difficult to interpret, but it can provide a very accurate fit when the relationship is highly non - linear.
Choosing the Right Fitting Method
So, how do you choose the right calibration curve fitting method for your Hexavalent Chromium Analyzer? Here are some factors to consider:
- Nature of the relationship: If the relationship between the concentration and the response is linear, linear regression is a good choice. If it's non - linear, you may need to try polynomial or non - linear regression. You can get an idea of the relationship by plotting the calibration data.
- Accuracy requirements: If high accuracy is required, non - linear regression may be the best option, especially if the relationship is complex. However, if a rough estimate is sufficient, linear regression may be adequate.
- Data quality: The quality of your calibration data can also affect the choice of fitting method. If the data has a lot of noise or outliers, some methods may be more robust than others. For example, linear regression can be sensitive to outliers, while non - linear regression may be more forgiving.
Our Hexavalent Chromium Analyzers
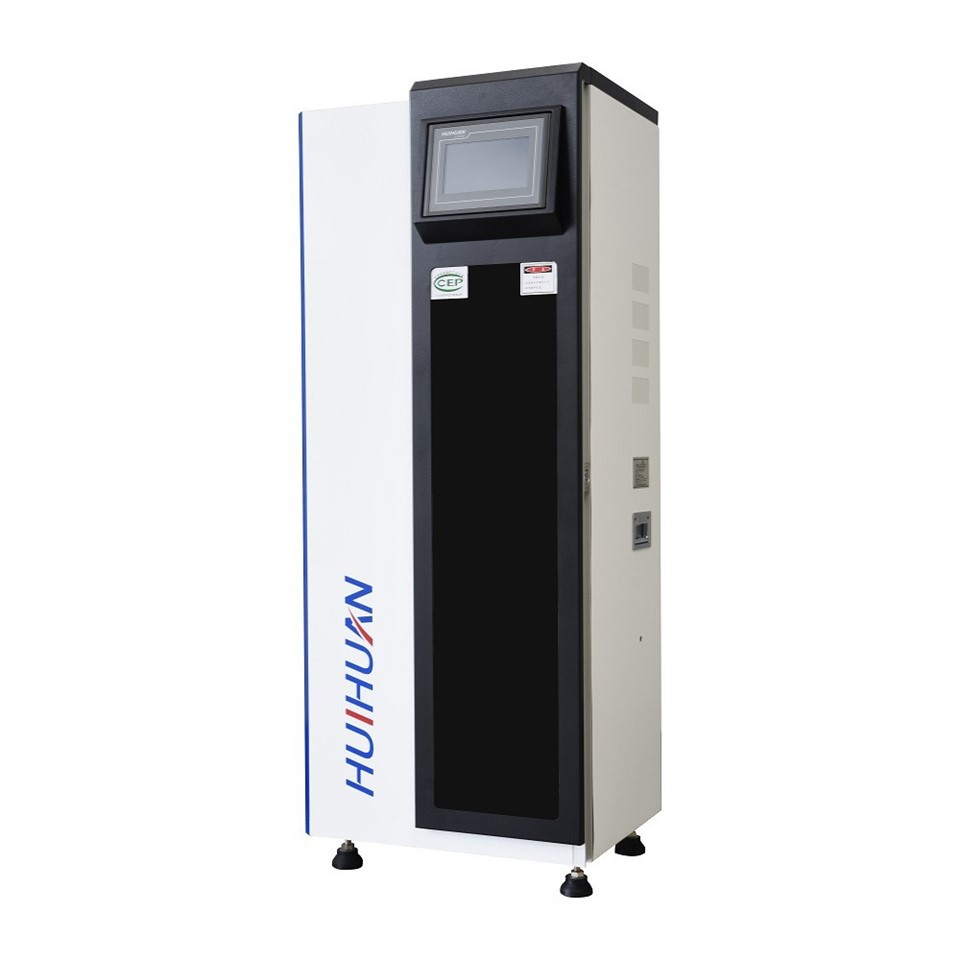
At our company, we offer high - quality Hexavalent Chromium Analyzers that are designed to provide accurate and reliable results. Our analyzers are easy to calibrate, and we provide support to help you choose the best calibration curve fitting method for your needs.
In addition to our Hexavalent Chromium Analyzers, we also offer other water quality monitoring products, such as the Monitoring Analyzer for Surface Water, the Multi Parameter Water Quality Analyzer, and the Online Total Nitrogen Analyzer. These products are designed to meet the diverse needs of our customers in environmental monitoring, industrial process control, and research.
Contact Us for Purchasing
If you're interested in our Hexavalent Chromium Analyzers or any of our other water quality monitoring products, we'd love to hear from you. Whether you have questions about calibration, need more information about our products, or are ready to place an order, feel free to reach out. Our team of experts is here to assist you every step of the way. Let's work together to ensure accurate and reliable water quality analysis.
References
- Miller, J. N., & Miller, J. C. (2010). Statistics and Chemometrics for Analytical Chemistry. Pearson Education.
- Skoog, D. A., West, D. M., Holler, F. J., & Crouch, S. R. (2013). Fundamentals of Analytical Chemistry. Cengage Learning.